Tutorial: Understanding Jupyter Notebook Widgets

Introduction:
Jupyter Notebook Widgets are interactive elements that can be added to Jupyter notebooks to enhance the user experience by allowing users to manipulate and visualize data dynamically. Widgets provide a way to create interactive dashboards, data exploration tools, and user interfaces directly within Jupyter notebooks.
In this tutorial, we will explore what Jupyter Notebook Widgets are, what they can be used for, how to use them, and provide an example with code.
To read the full comprehensive guide to Jupyter Notebooks, click here.
What are Widgets?
Widgets in Jupyter Notebook are interactive components or controls that allow users to interact with data and dynamically modify it. They can be buttons, sliders, checkboxes, dropdown menus, text boxes, and more. These widgets enable users to create rich and responsive user interfaces in notebooks, making data exploration and analysis more intuitive and engaging.
What can Widgets be used for?
Widgets have a wide range of applications, including:
- Data visualization: Widgets can be used to create interactive charts, plots, and graphs that respond to user inputs.
- Parameter tuning: Widgets allow users to dynamically adjust parameters in models or algorithms and observe the effects in real-time.
- Data exploration: Widgets enable users to filter and interact with data, providing a more dynamic and interactive exploration experience.
- Dashboard creation: Widgets can be combined to create interactive dashboards and reports, allowing users to explore data from multiple angles.
How to Use Widgets:
Before using widgets, let’s start a new jupyter notebook by typing this on your terminal:
jupyter notebook
To use widgets in Jupyter Notebook, you need to install the ipywidgets library. You can install it using the following command:
!pip install ipywidgets
Basic Widget
After installation, you need to import the necessary modules from ipywidgets, which provides the classes and functions for creating and using widgets. Here’s an example import statement:
import ipywidgets as widgets
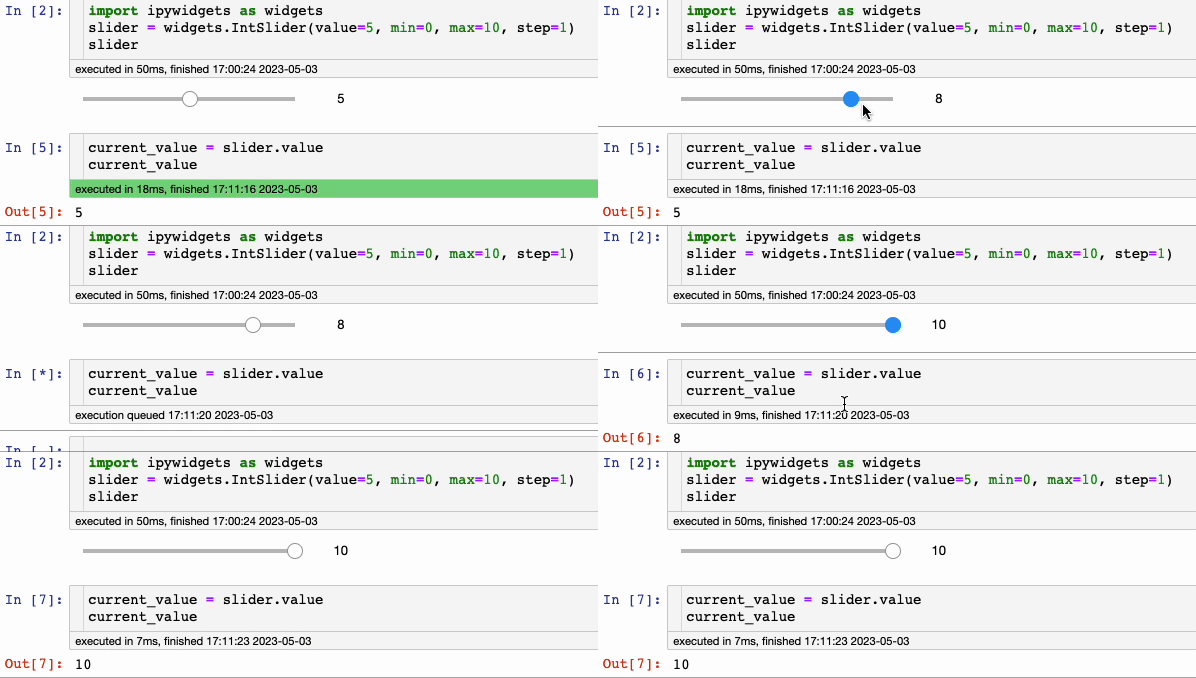
Next, you can create an instance of a widget class with the desired parameters. Widgets have various types, such as sliders, buttons, checkboxes, dropdown menus, and text boxes. Here’s an example of creating a simple slider widget:
slider = widgets.IntSlider(value=5, min=0, max=10, step=1)
In this case, we create an IntSlider widget that represents an integer value. It has an initial value 5, a minimum value of 0, a maximum value of 10, and a step size of 1.
To display the widget, you can simply write the name of the widget object in a Jupyter Notebook cell:
slider

To access the current value of a widget, you can use the .value attribute. For example, to retrieve the current value of the slider widget, you can do the following:
current_value = slider.value
current_value

Interactive Function:
Widgets can also be used to interact with functions. The interact function from ipywidgets allows you to create a widget that interacts with a function. Here’s an example:
from ipywidgets import interact

@interact
def greet(name="World", count=5):
    for _ in range(count):
        print(f"Hello, {name}!")

greet()

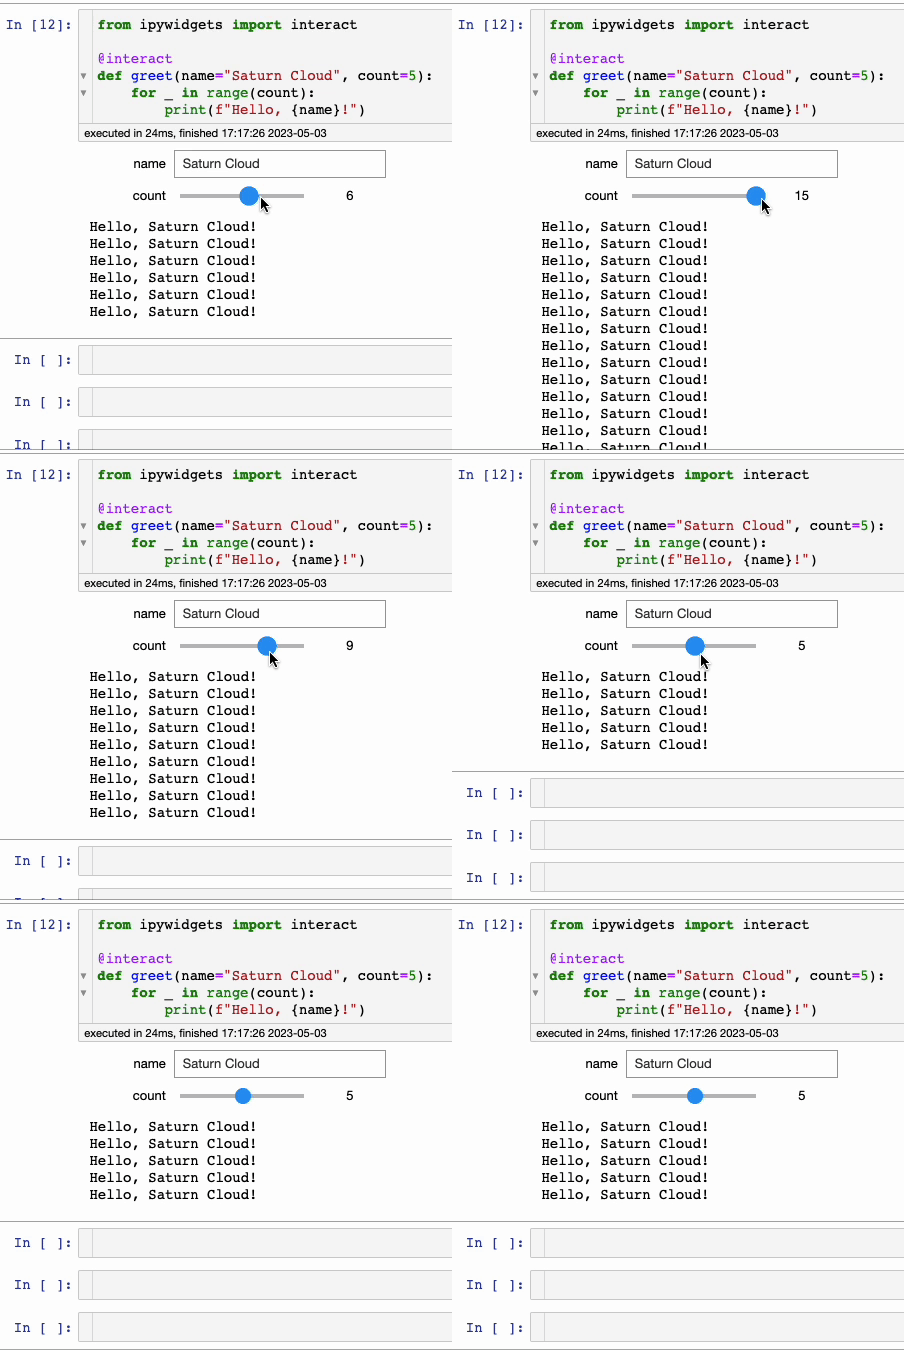
In this example, the greet function takes two arguments: name (a string) and count (an integer). The @interact decorator creates interactive widgets based on these arguments. By default, the name argument is set to “World” and the count argument is set to 5.
When you call the function, Jupyter Notebook will generate widgets for both arguments and display them. You can interact with the widgets by modifying their values. As you change the values, the function will be called automatically, and the greetings will be printed to the output cell.
Widget Callbacks:
Widgets can be connected to Python functions, enabling you to respond to changes in widget values. Here’s an example using a slider and a function that updates a plot based on the slider’s value:
import ipywidgets as widgets

slider = widgets.IntSlider(value=0, min=0, max=100, step=1)
output = widgets.Output()

def handle_slider_change(change):
    with output:
        output.clear_output()
        print(f"The new slider value is: {change.new}")

slider.observe(handle_slider_change, 'value')

widgets.VBox([slider, output])

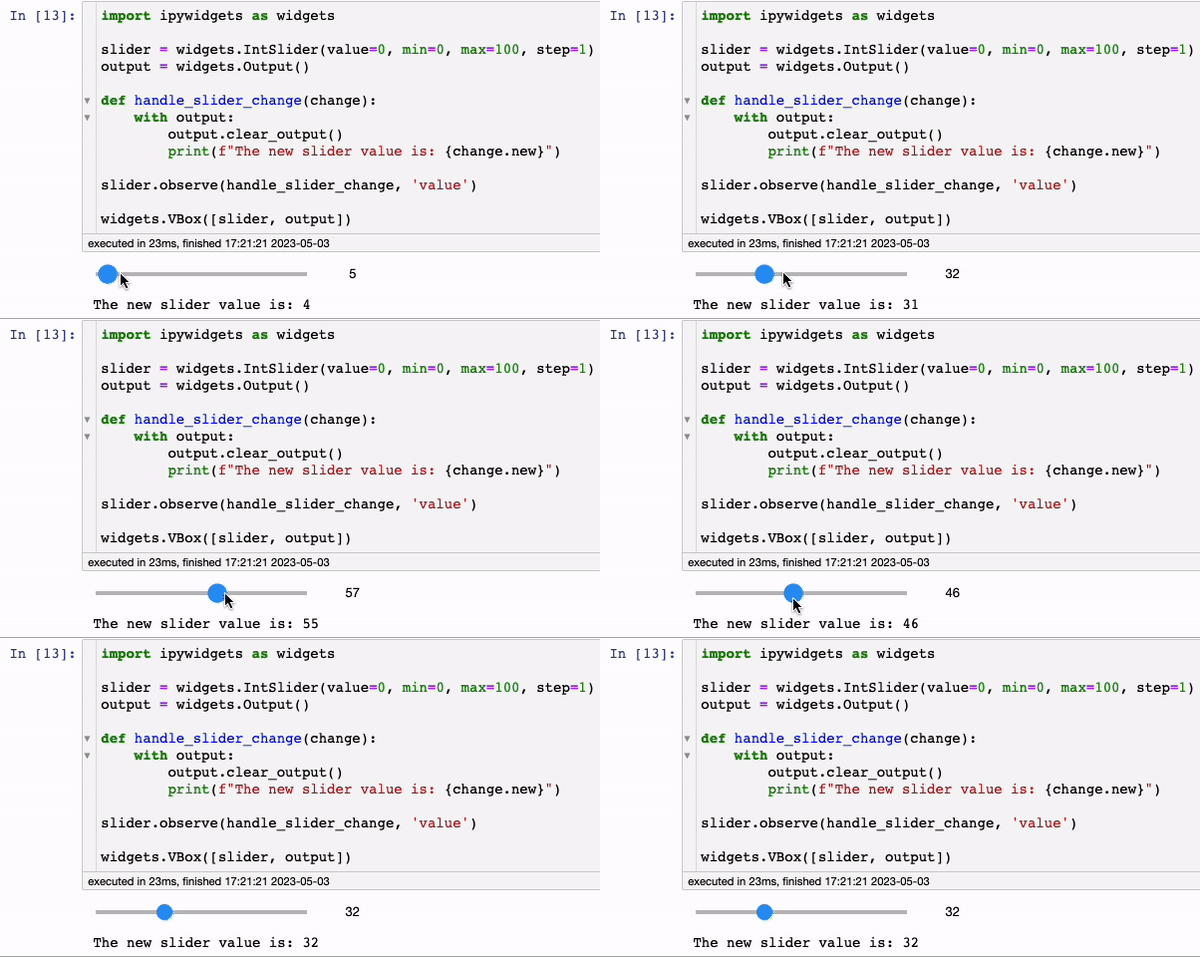
In this example, we create an IntSlider widget, slider, with a range from 0 to 100. We also create an Output widget, output, to display the updated value of the slider.
The handle_slider_change function is defined as the callback function for the slider widget. It uses the with output block to ensure that the output is cleared and the new value is printed within the output widget.
We connect the handle_slider_change function to the slider widget using the .observe() method, observing changes in the value attribute.
Finally, we use the widgets.VBox() function to display the slider and output widgets vertically in the notebook.
Use Widgets for better Exploratory Data Analysis (EDA) experience
In this part, we are going to use some popular widgets to perform some EDA tasks such as find mean, median and plot some graphs. We are going to use the Penguine Dataset which can be found here.
penguins = pd.read_csv('penguins_size.csv')
This dataset contains measurements of various penguin species collected on different islands, including body mass, bill length and depth, and flipper length.
We then define a function called eda_widget() that takes three arguments representing the selected values of the sex, island, and species widgets. The purpose of this function is to perform exploratory data analysis on the penguins dataset based on the selected widget values, and generate some summary statistics and visualizations.
def eda_widget(sex, island, species):
    # Filter the dataset based on the selected widget values
    df = penguins[(penguins['sex'] == sex) & (penguins['island'] == island) & (penguins['species'] == species)]

    # Compute some summary statistics
    num_rows = len(df)
    mean_body_mass = df['body_mass_g'].mean()
    median_body_mass = df['body_mass_g'].median()

    # Create some plots
    fig, axs = plt.subplots(ncols=2, figsize=(12, 6))
    sns.histplot(data=df, x='culmen_length_mm', hue='sex', ax=axs[0])
    axs[0].set_title('Distribution of culmen length by sex')
    sns.scatterplot(data=df, x='culmen_depth_mm', y='body_mass_g', hue='species', ax=axs[1])
    axs[1].set_title('Scatter plot of culmen depth vs. body mass by species')
    plt.show()

    # Display the summary statistics
    print(f"Number of penguins: {num_rows}")
    print(f"Mean body mass: {mean_body_mass:.2f} g")
    print(f"Median body mass: {median_body_mass:.2f} g")
In this function, we first filter the penguins dataset based on the selected widget values using Pandas boolean indexing. We create a new DataFrame called df that contains only the rows where the sex, island, and species columns match the selected values.
We then compute some summary statistics for the filtered DataFrame using Pandas methods. We calculate the number of rows in the DataFrame using the len() function, and the mean and median body mass using the mean() and median() methods of the body_mass_g column.
Finally, we generate two plots using the seaborn library. The first plot is a histogram of bill length by sex, and the second plot is a scatter plot of bill depth vs. body mass by species. We display the plots using the plt.show() function.
We also display the summary statistics using the print() function. We use formatted strings to insert the calculated values into the output.
Next, we create three widgets using the Dropdown class from the ipywidgets library:
sex_widget = widgets.Dropdown(options=['MALE', 'FEMALE'], description='Sex:')
island_widget = widgets.Dropdown(options=['Biscoe', 'Dream', 'Torgersen'], description='Island:')
species_widget = widgets.Dropdown(options=['Adelie', 'Chinstrap', 'Gentoo'], description='Species:')
We next create an instance of the interact() function from the ipywidgets library. This function takes the eda_widget() function as its first argument, and the three widget objects as its remaining arguments. The purpose of this function is to create a user interface that allows the user to select values for the three widgets and see the results of the eda_widget() function based on their selections.
widgets.interact(eda_widget, sex=sex_widget, island=island_widget, species=species_widget);
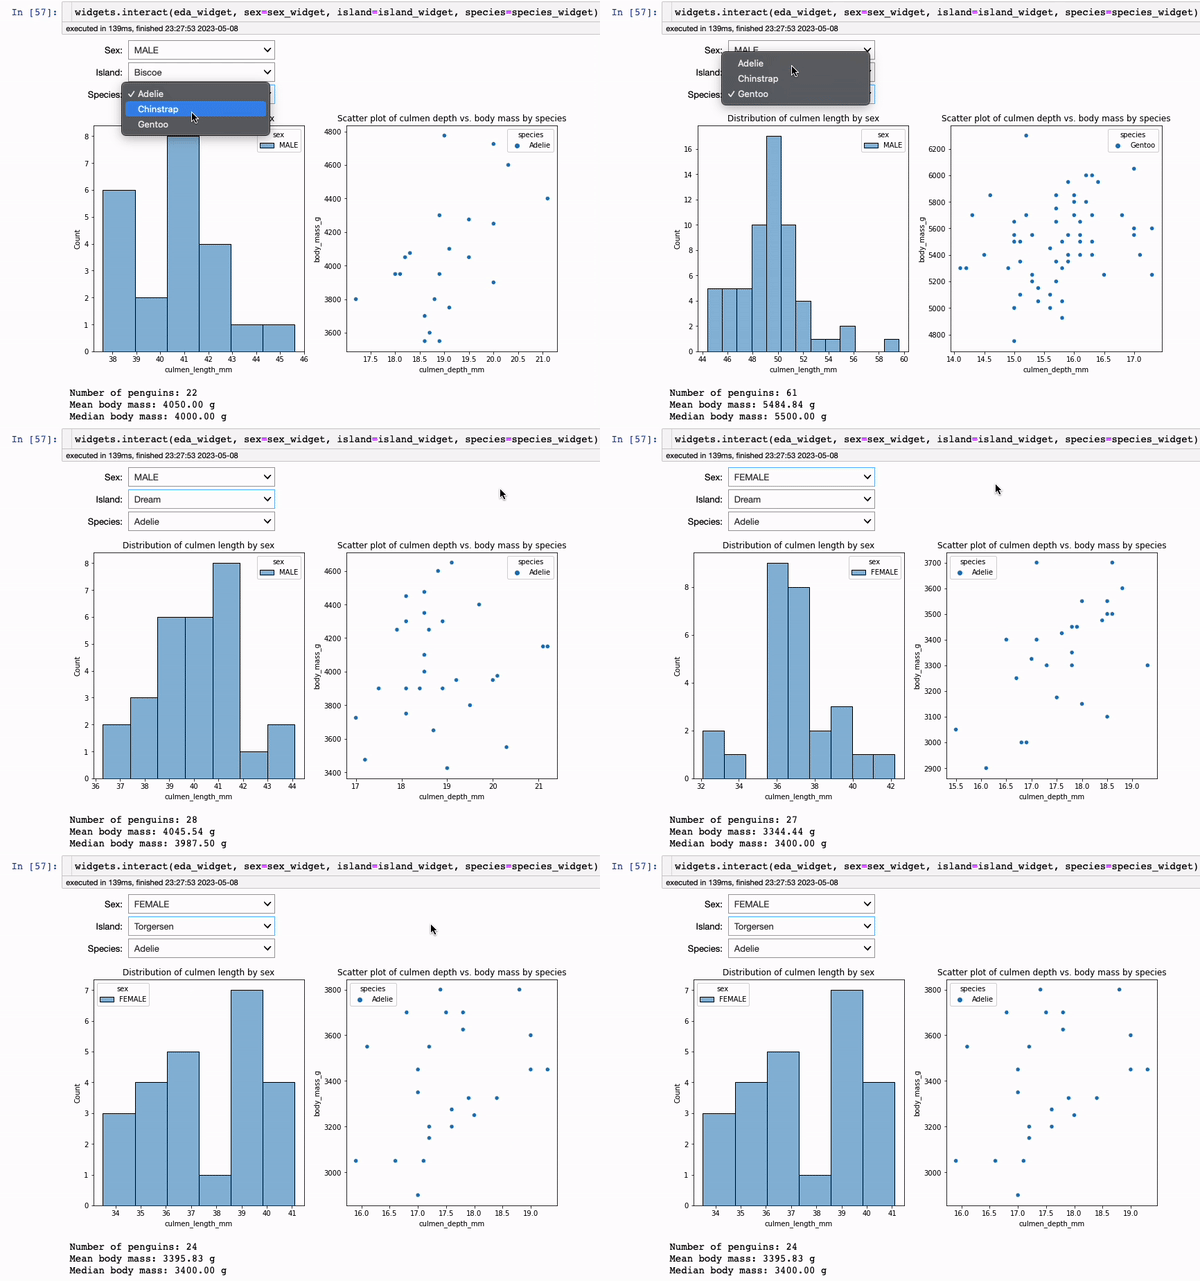
Finally, we call the interact() function with the eda_widget() function and the three widget objects as its arguments. This generates the user interface, which consists of three dropdown menus for selecting the sex, island, and species of the penguins, and displays the output of the eda_widget() function based on the selected values.
When the user selects a value for any of the widgets, the eda_widget() function is automatically called with the selected values, and the output is updated in real-time. The user can explore the dataset by changing the widget values and observing the corresponding summary statistics and plots.

Conclusion:
Jupyter Notebook Widgets provide a powerful way to create interactive and dynamic interfaces within Jupyter notebooks. They allow users to manipulate and visualize data in real-time, enhancing the data exploration and analysis experience. By following this tutorial, you have learned what widgets are, their applications, how to use them, and seen an example of creating an interactive widget. Experiment with widgets to build engaging and interactive notebooks for your data analysis tasks. We also perform a simple EDA task using widgets which brought more convenience to visualization.
If you’d like to get a quick start and jump into high-powered notebooks using these extensions, get started on Saturn Cloud for free here.
You may also be interested in:
- A Comprehensive Guide to JupyterLab
- [8 Easy Ways to Run Your Jupyter Notebook in the Cloud](https://saturncloud.io/blog/8-easy-ways-to-run-your-jupyter-notebook-in-the-cloud-2023-update/)
- [Authenticate Box on JupyterHub on Kubernetes](https://saturncloud.io/blog/authenticate-box-on-jupyterhub-on-kubernetes/)
About Saturn Cloud
Saturn Cloud is a portable AI platform that installs securely in any cloud account. Build, deploy, scale and collaborate on AI/ML workloads-no long term contracts, no vendor lock-in.
Saturn Cloud provides customizable, ready-to-use cloud environments
for collaborative data teams.
Try Saturn Cloud and join thousands of users moving to the cloud without having to switch tools.


