Deploy Your Machine Learning Model - Part 2 (Voila Web App)

This post continues our series about deploying machine learning models with Saturn Cloud - if you missed it, read Part 1 here. If you’d rather deploy using Flask, either as a web app or an API, move on to Part 3.
Our Toolkit
- Saturn Cloud (so you can deploy easily!)
- Voila
- Plotly (python and JS)
- Scikit-learn (for our model)
Other Helpful Links
- ipywidgets (helpful for Voila)
- codebook for the dataset
- plotly.js cheat sheet
Since you created the model in Part 1 of this series, you have everything you need to produce a deployment. Read on to learn how!
Voila
Now we are ready to start building our Voila app. Voila is entirely contained in a Jupyter notebook, so you’ll need to start a new notebook, and add in all the functions we wrote up above. You don’t need any other file types or frameworks, you can do it all in one notebook! You can go ahead and add a chunk with calls for the modeling functions, so we are ready with our data.
df = load_data()
X, y = split_data(df)
modobj, modscore = trainmodel(X, y)
With this, we have our raw data, our model object, and the R-squared value.
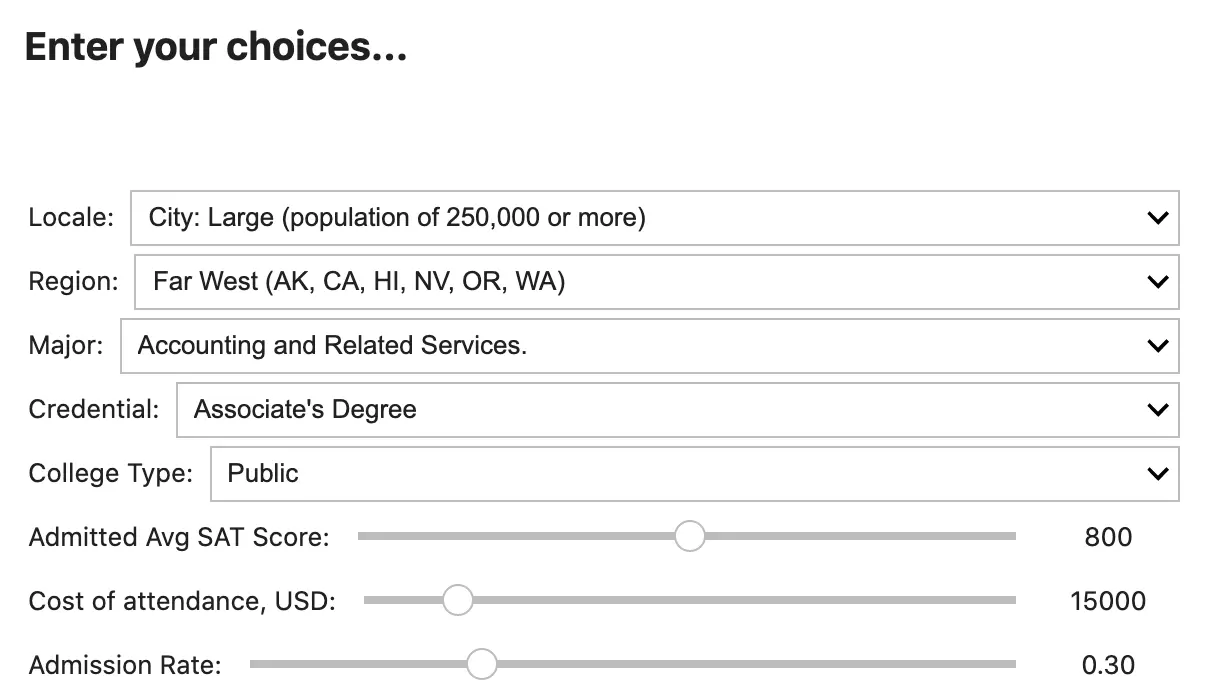
Next, we start building the widgets — this is how your viewer will make selections to populate the prediction. In one or more chunks, add a widget for every input the user might want to make — here’s one example. These can reference the items you’ve created already in the notebook — as we did here, that might mean using data from the dataset to populate a selector. (Sort this the way you want it to appear, because the widget is not going to reorder the list.)
creds = sorted(list(df['CREDDESC'].unique()))

credential_widget = widgets.Dropdown(
    options=creds,
    value="Associate's Degree",
    description='Credential:',
    style = {'description_width': 'initial'},
    layout=widgets.Layout(width='80%')

)
When you have all your widgets created and the app runs, your input selectors will look something like this.
Create Rendering Functions
The next task is to put all this together with functions that listen for user inputs, and complete a task — for us, this is predicting the earning value.
You can write one or many of these functions, but the key is how you call them in the interactive_output wrapper.
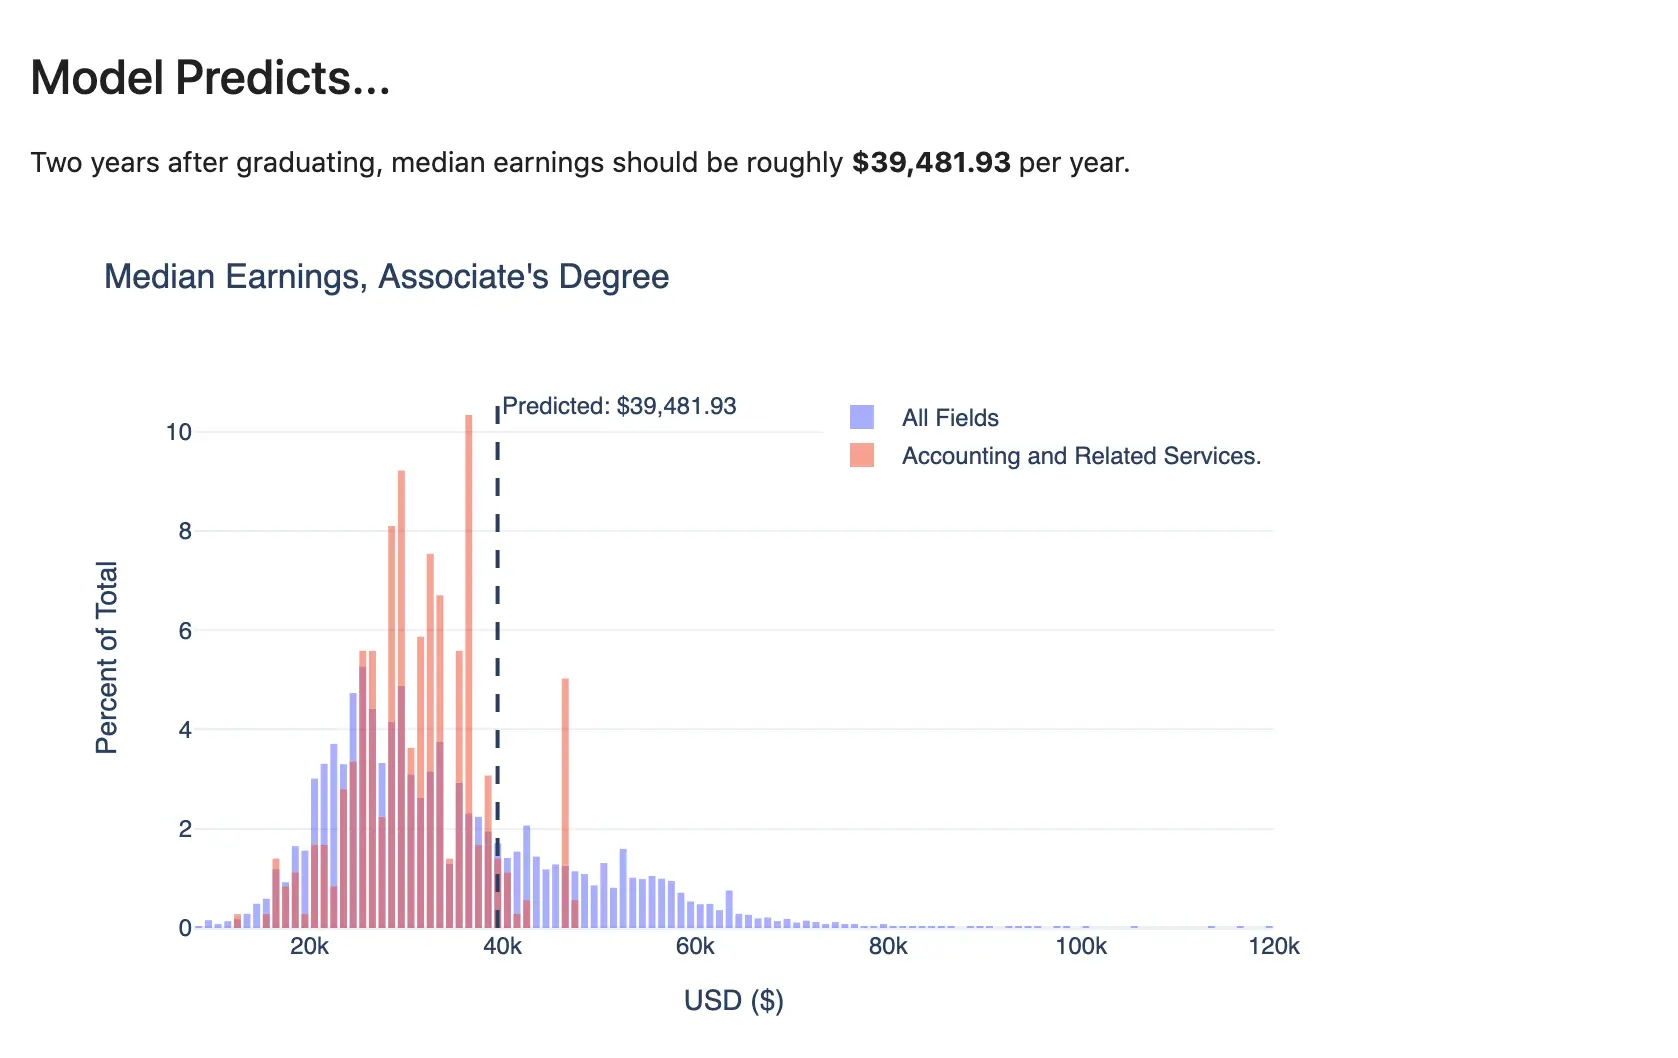
This function listens for all the input widgets, and when any of them change, it runs. It accepts all the user inputs, and forms them into a dataframe that is shaped correctly for the model object. It predicts on that dataframe, and then creates an HTML chunk using f-strings. Then it calls our plotting function, described earlier. It displays the HTML and the plot together, and this is what we’ll see on the app.
def results2(sat, cred, cip, col, reg, tuit, loc, adm):
    newdf = pd.DataFrame([[sat, cred, cip, col, reg, tuit, loc, adm]],
        columns = ['SAT_AVG_ALL','CREDDESC', 'CIPDESC_new','CONTROL',
                  'REGION', 'tuition', 'LOCALE', 'ADM_RATE_ALL'])

    [[prediction]] = modobj.predict(newdf)
    pred_final = prediction if prediction > 0 else np.nan

    pred_html = f"""
      <hr>
      <h2> Model Predicts... </h2>
        Two years after graduating, median earnings should be
        roughly <b> ${round(pred_final, 2):,} </b>per year.
    """

    display(HTML(pred_html))
    p3 = plotly_hist(df=major, degreetype=cred, prediction=pred_final,
                     majorfield=cip)
    display(go.FigureWidget(p3))
However, recall that I mentioned we need to call it as an interactive_output. If we don’t, Voila doesn’t know we mean for this to listen for inputs and run. But this is a simple task, just one call, as shown here. It calls the function, and also passes a dict containing the arguments as keys and the widget names as values.
out2 = widgets.interactive_output(results2,
				 {'loc':locale_widget,
			    'reg':region_widget,
			    'cip':cippick_widget,
			    'cred':credential_widget,
			    'col':coltype_widget,
			    'sat':sat_widget,
			    'tuit':tuit_widget,
			    'adm':adm_widget})
At this point, we’re ready to do our page layout. You can certainly add lots of other design elements if you want to, and pass them as HTML or as other widgets.
Page Layout
To do our layout, I’m using the Grid elements of Voila — but there are many ways to arrange a Voila app that are not shown here. As you might guess, VBox means vertical box and HBox means horizontal box, and those are the containers I’m using.
My vertical box is called vb, and it holds all my widgets for the user to interact with. My horizontal box, which will lay below this, is called hb, and it contains the out2 interactive widget created earlier. “children” here just means the items that go inside each box. You can manipulate some layout elements for these boxes right here.
vb = widgets.VBox()
vb.children = [locale_widget,
    region_widget,
    cippick_widget,
    credential_widget,
    coltype_widget,
    sat_widget,
    tuit_widget,
    adm_widget]

hb = widgets.HBox(layout=Layout(width='auto', grid_area='hb'))
hb.children = [out2]
The next thing I want to do is create my actual Grid. I’m making gb my grid, and it contains the two objects vb and hb. The Grid spans 80% of the page width, and is 2x2 shaped. The columns are each half the size of the grid wide, and the grid template is described. Grid styling can be hard, but there’s a great tutorial with diagrams that can help.
gb = widgets.GridBox()
gb.children = [vb, hb]
gb.layout.width='80%'
gb.layout.grid_template_rows='auto auto'
gb.layout.grid_template_columns='50% 50%'
gb.layout.grid_template_areas='''"vb . "
                                 "hb hb"'''
Now you’re ready to run your app. Run this chunk, and your app should appear right in your notebook page!
display(gb)
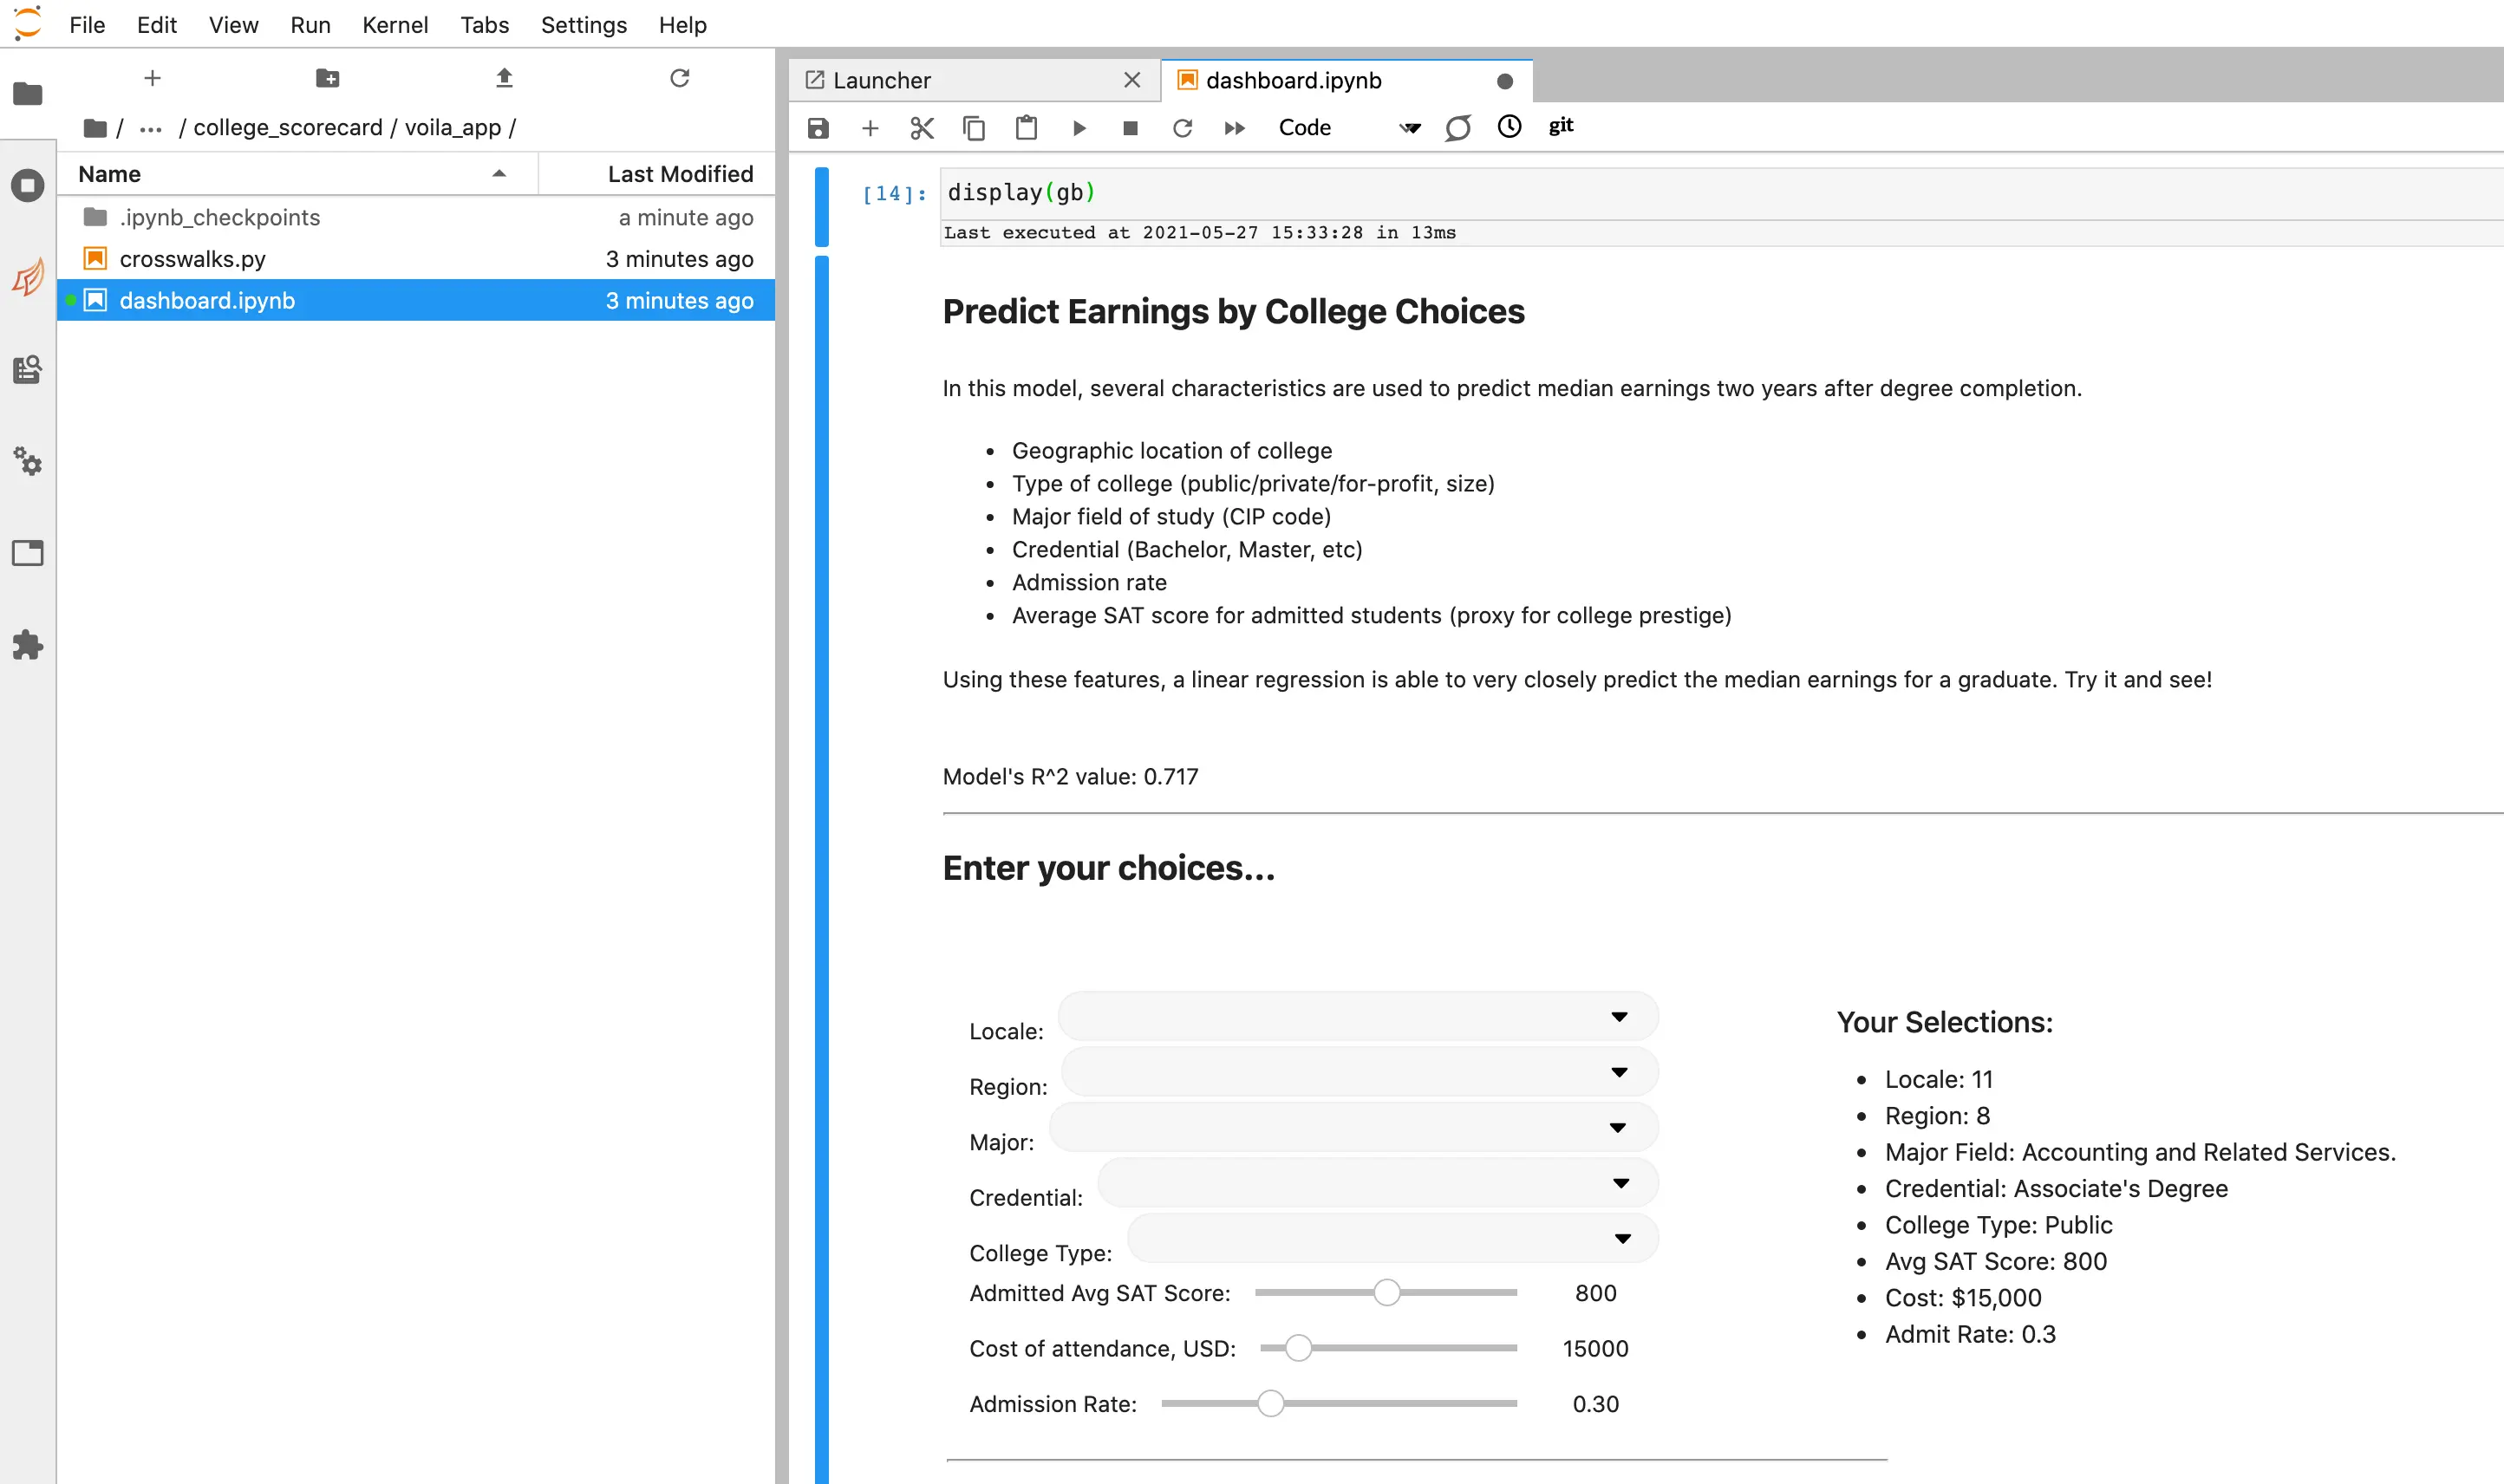
That’s nice, but it’s not quite what we want our final product to be. To deploy this notebook for other users to see is a simple task with Saturn Cloud.
Deploy
Make sure your code is in a Github repo you can access. Go to the Saturn Cloud project of your choice, and connect that repo to your project. (https://www.saturncloud.io/docs/user-guide/gitrepo.md/) This is how your deployment will find the code.
Then return to the Saturn Cloud UI, and open a project. Inside the project page, go down to Deployments. You have the opportunity to customize a lot here, but the most important piece is the command — this needs to use the host 0.0.0.0 and the port 8000 to run on Saturn Cloud correctly. It’s the same command you might use if running Voila locally on your laptop, just make sure the port and host are right. The path to your code is likely to start ../git-repos/ and will then be followed with the path to your file inside the repo you attached.
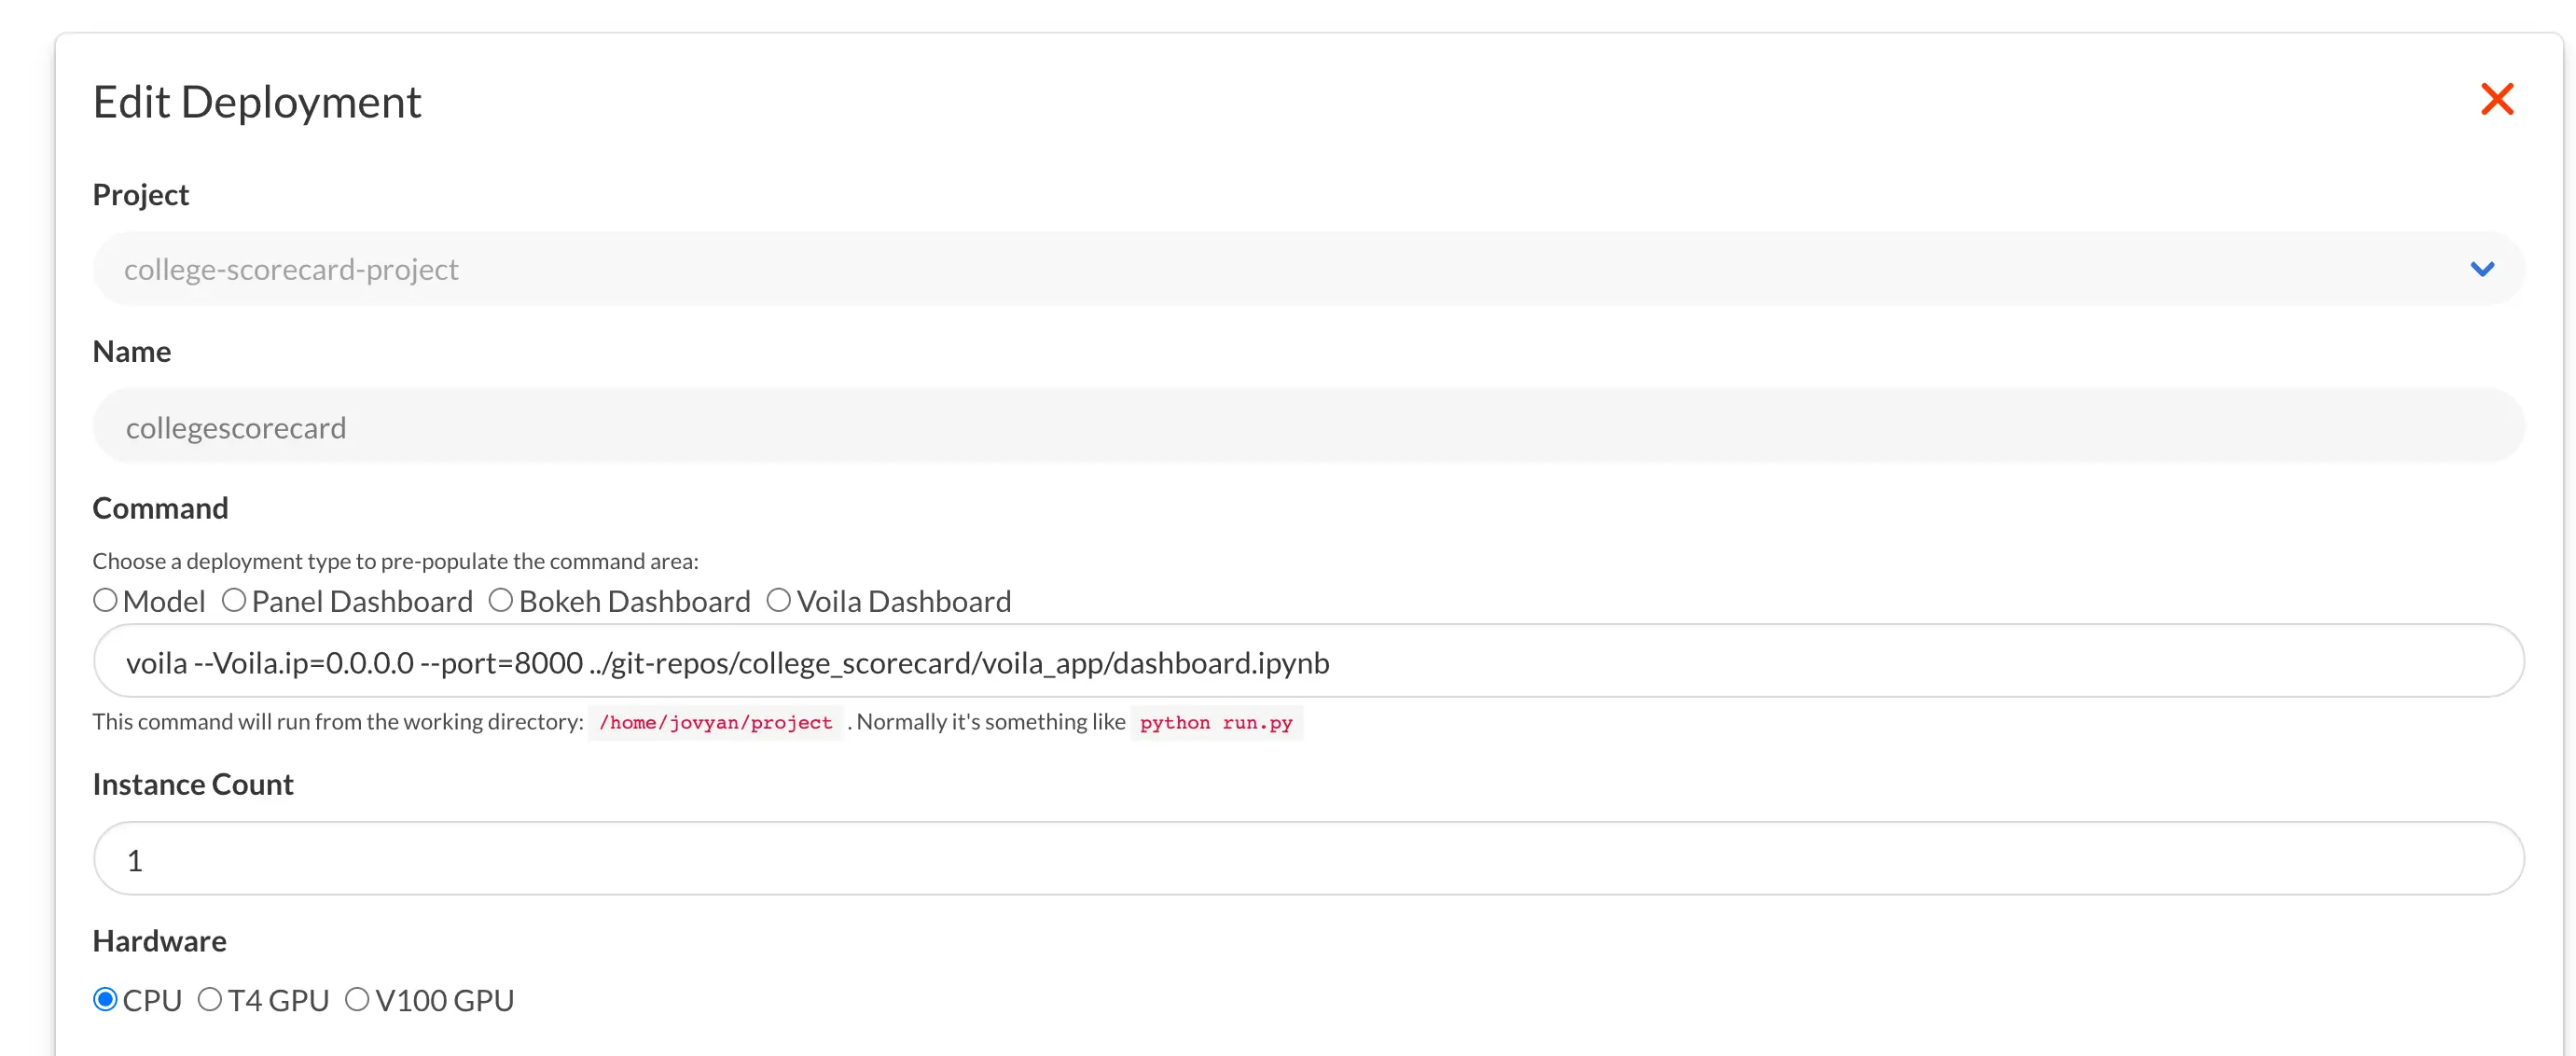
For this project, there’s not much else you need to change, except that you should ensure that inside the Extra Packages section you note that plotly is required.

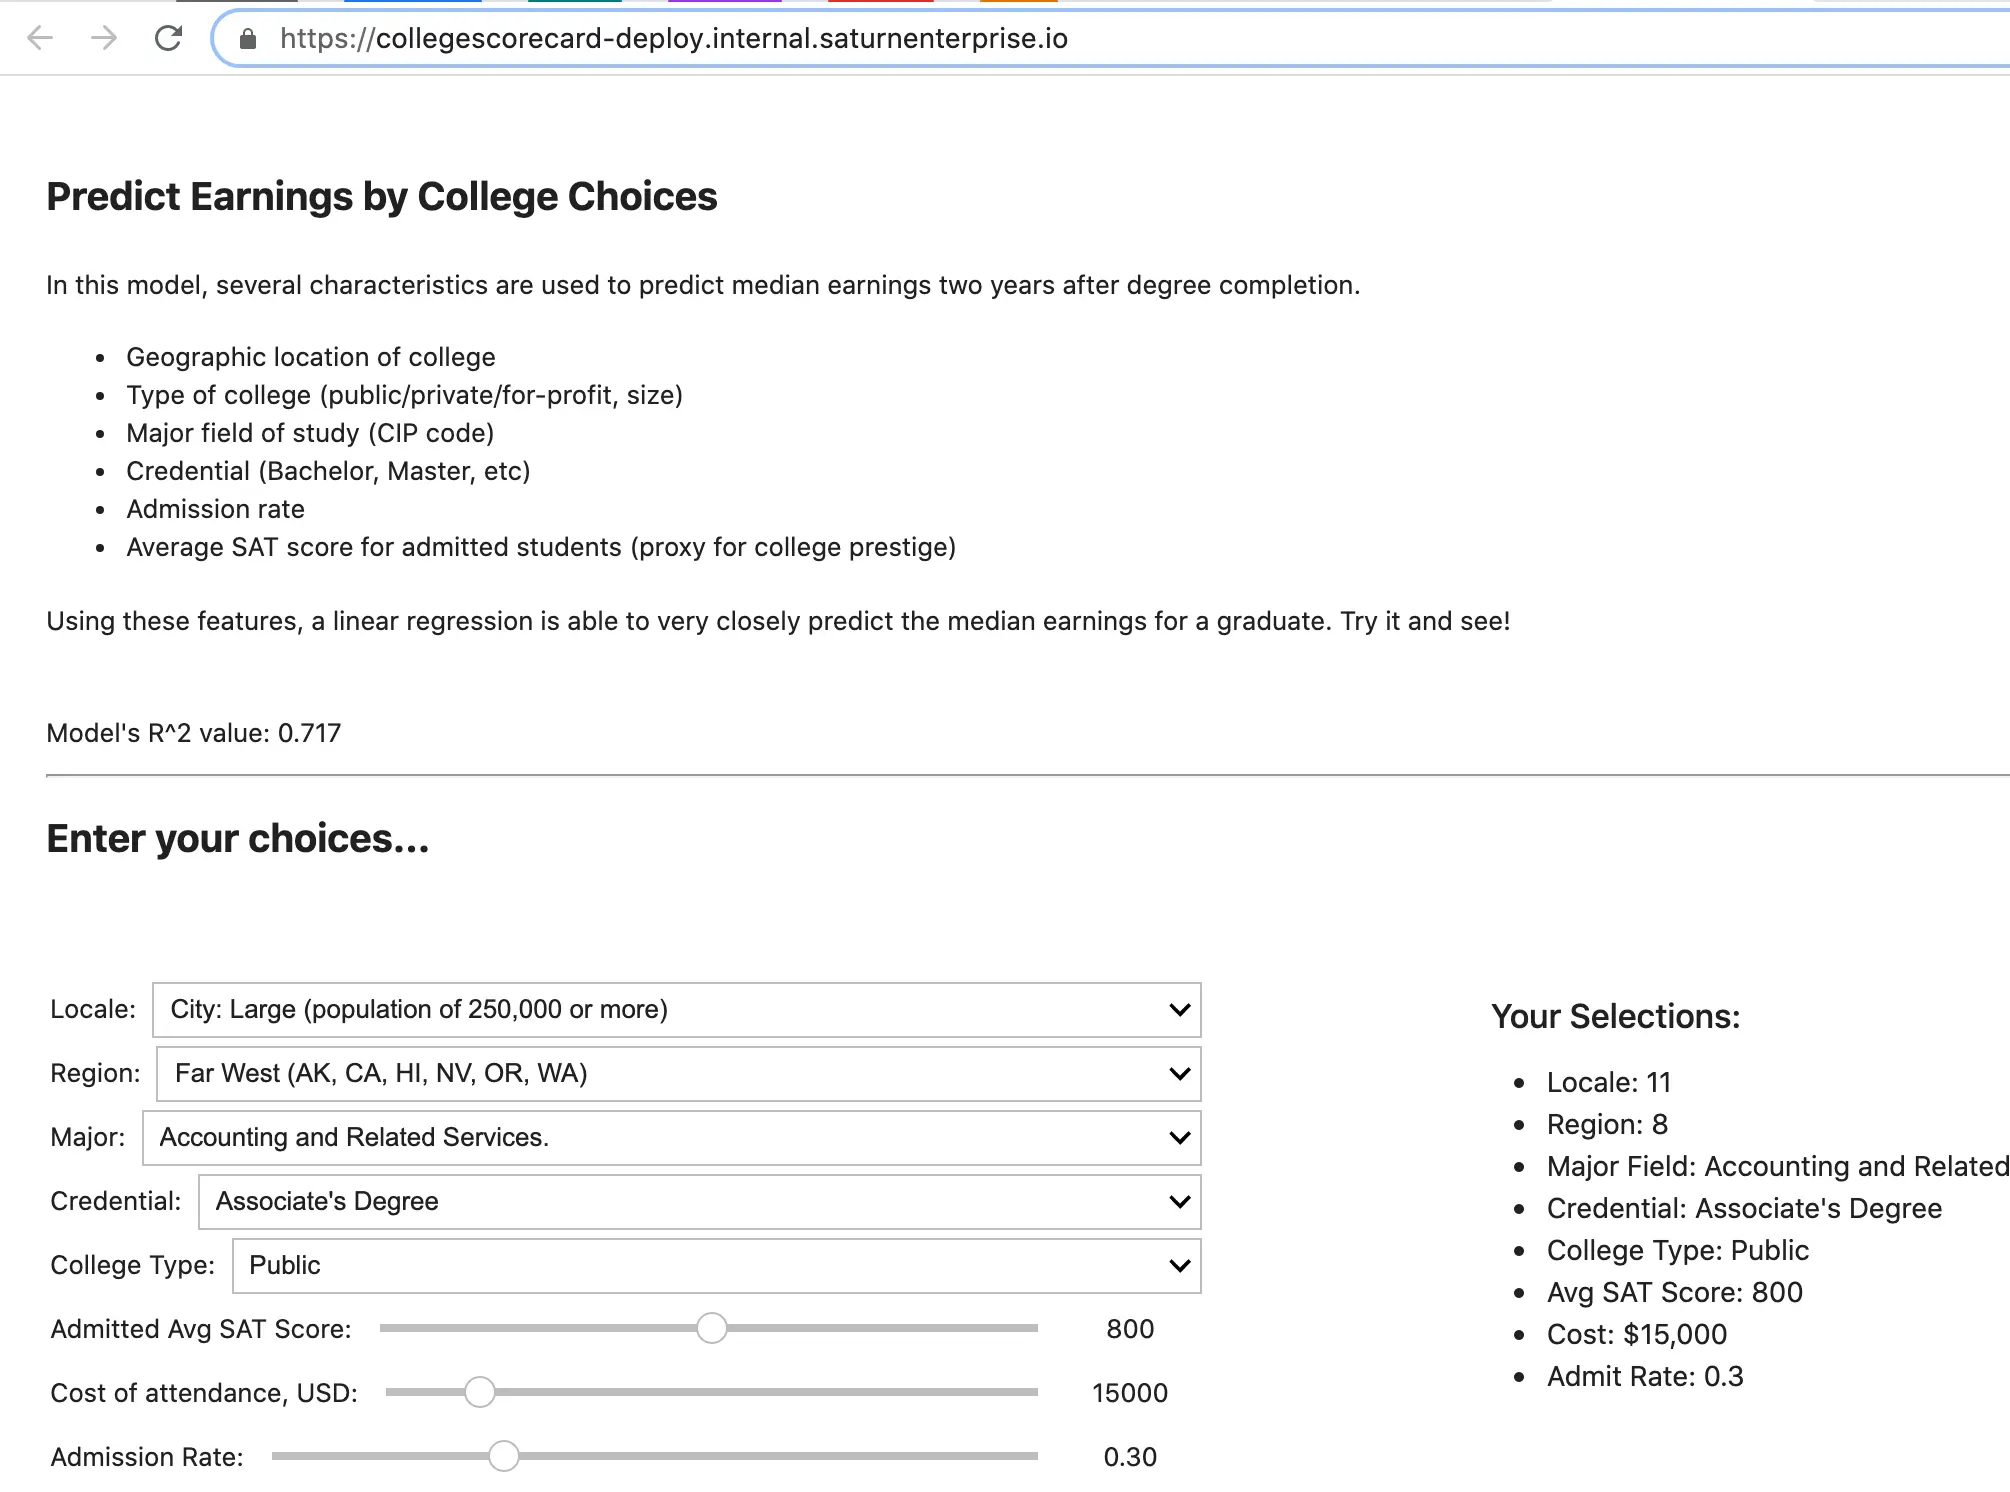
Now, save your deployment and hit the green Start arrow! It’ll take a moment to start, and then the URL of that deployment should display your interactive app. Mine has a few extra text elements to explain the app, and you can write this sort of thing in yours too.
Conclusion
Congratulations - you deployed a model! This technique can work for lots of different types of model, and if you’d like to try it on Saturn Cloud, we would love to have you join us. Check out our getting started documentation for more guides, and consider whether our Saturn Hosted Free, Saturn Hosted Pro, or Enterprise plan is best for you!
In Part 3 of this series, you’ll learn the process of deploying your model as either a web application or a REST API with Flask.
Thank you to Joseph Chan on Unsplash for the header image for this post!
About Saturn Cloud
Saturn Cloud is a portable AI platform that installs securely in any cloud account. Build, deploy, scale and collaborate on AI/ML workloads-no long term contracts, no vendor lock-in.
Saturn Cloud provides customizable, ready-to-use cloud environments
for collaborative data teams.
Try Saturn Cloud and join thousands of users moving to the cloud without having to switch tools.


